Boston Has Taken 153 Permit Applications With an Accessory Dwelling Unit This Year, Already 85 Percent of 2025's Total
The city's Zoning Reform Impact Tracker, updated Tuesday, shows ADU applications rising for a third straight year as abandoned filings fall, though most 2026 applications have not yet reached a permit.
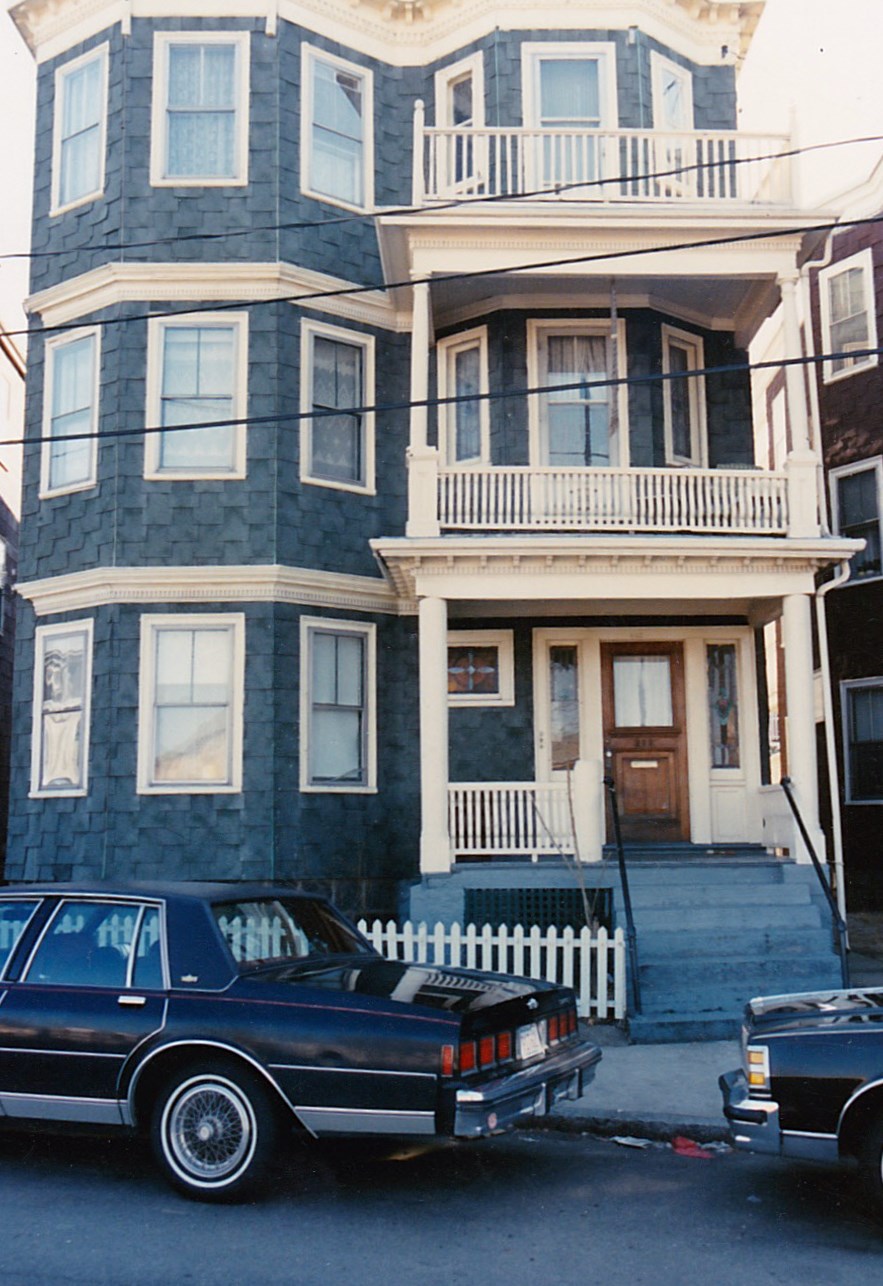
Boston has logged 153 building-permit applications that include an accessory dwelling unit so far this year, about 85 percent of the 181 filed in all of 2025, according to the city's Zoning Reform Impact Tracker, a dataset the Planning Department and the Inspectional Services Department updated on Tuesday.
The tracker is a new public record of what happens to permit applications at City Hall. Each row is an application filed on or after Jan. 1, 2018 for an alteration, an amendment, a change to an outdoor portion of land or new construction. The city says it is the first time it has published measures of by-right development, abandoned projects, accessory dwelling units, the most common zoning violations, the time projects spend at the Zoning Board of Appeal and the time between applying for a permit and receiving it. As of Tuesday it held 37,261 applications, the latest filed on Oct. 26.
Counting by filing year, the number of applications flagged as including an ADU has risen from 55 in 2018 to 85 in 2019, 92 in 2020, 118 in 2021, 117 in 2022, 121 in 2023, 122 in 2024 and 181 in 2025. The 2025 total is 48 percent higher than 2024's. With about two months left in 2026, the 153 recorded this year already exceeds every year before 2025.
Fewer of those applications are dying on the vine. The tracker carries a field marking applications as abandoned; the dataset's definitions page explains the term. Of the ADU applications filed in 2021, 45 were marked abandoned. The figure was 34 for 2022, 26 for 2023, 19 for 2024 and 18 for 2025. For 2026 only two are marked abandoned so far, though that is partly a matter of time: an application filed this year has had less opportunity to lapse.
Time to a permit is where the data need the most caution. Among ADU applications that have been issued a permit, the median number of days from filing to issuance was 298 for those filed in 2018, 312 for 2019, 170 for 2020, 176 for 2021, about 298 for 2022, about 204 for 2023, 227 for 2024 and 137 for 2025. For applications filed this year and already issued, the median is 80 days. That figure is not a like-for-like comparison. Only 33 of this year's 153 ADU applications have been issued, and the ones that move quickly are the ones that appear in the calculation. As more of the 2026 applications are issued, the median is likely to rise.
For 2025, 83 of the 181 ADU applications have been issued, or about 46 percent. For 2024 the figure is 58 of 122, or about 48 percent. The tracker does not say how many of the remaining applications are still pending and how many are inactive, though it carries separate fields for both.
The same dataset also measures how much building happens without zoning relief. In the tracker, an application is flagged by-right when it needs no variance or other relief from the Zoning Board of Appeal. Roughly 33 percent of applications filed in 2018 were by-right, rising to 45 percent in 2023, 47 percent in 2024 and 47 percent in 2025. The 2026 figure so far is about 42 percent, but that share is likely to move because many 2026 applications have not completed zoning review.
The tracker cannot show why ADU applications are rising. Applications can reflect homeowners' interest, changes to the zoning code that the tracker is meant to measure, or both. The dataset also does not say how many applications involve a unit that would be rented, occupied by family or left vacant, and an application is not a completed home. Each row represents a request to the city, not a unit of housing. ADU applications are still a small slice of the tracker: they were about 1 percent of all applications filed in 2018 (55 of 5,250) and are about 5 percent of those filed in 2025 (181 of 3,800) and so far in 2026 (153 of 3,142).
The city says the tracker is meant to help assess the impact of changes to the zoning code. Readers can look up an individual application through the Inspectional Services Department's Permit Finder tool, and the data portal lists definitions for every field.